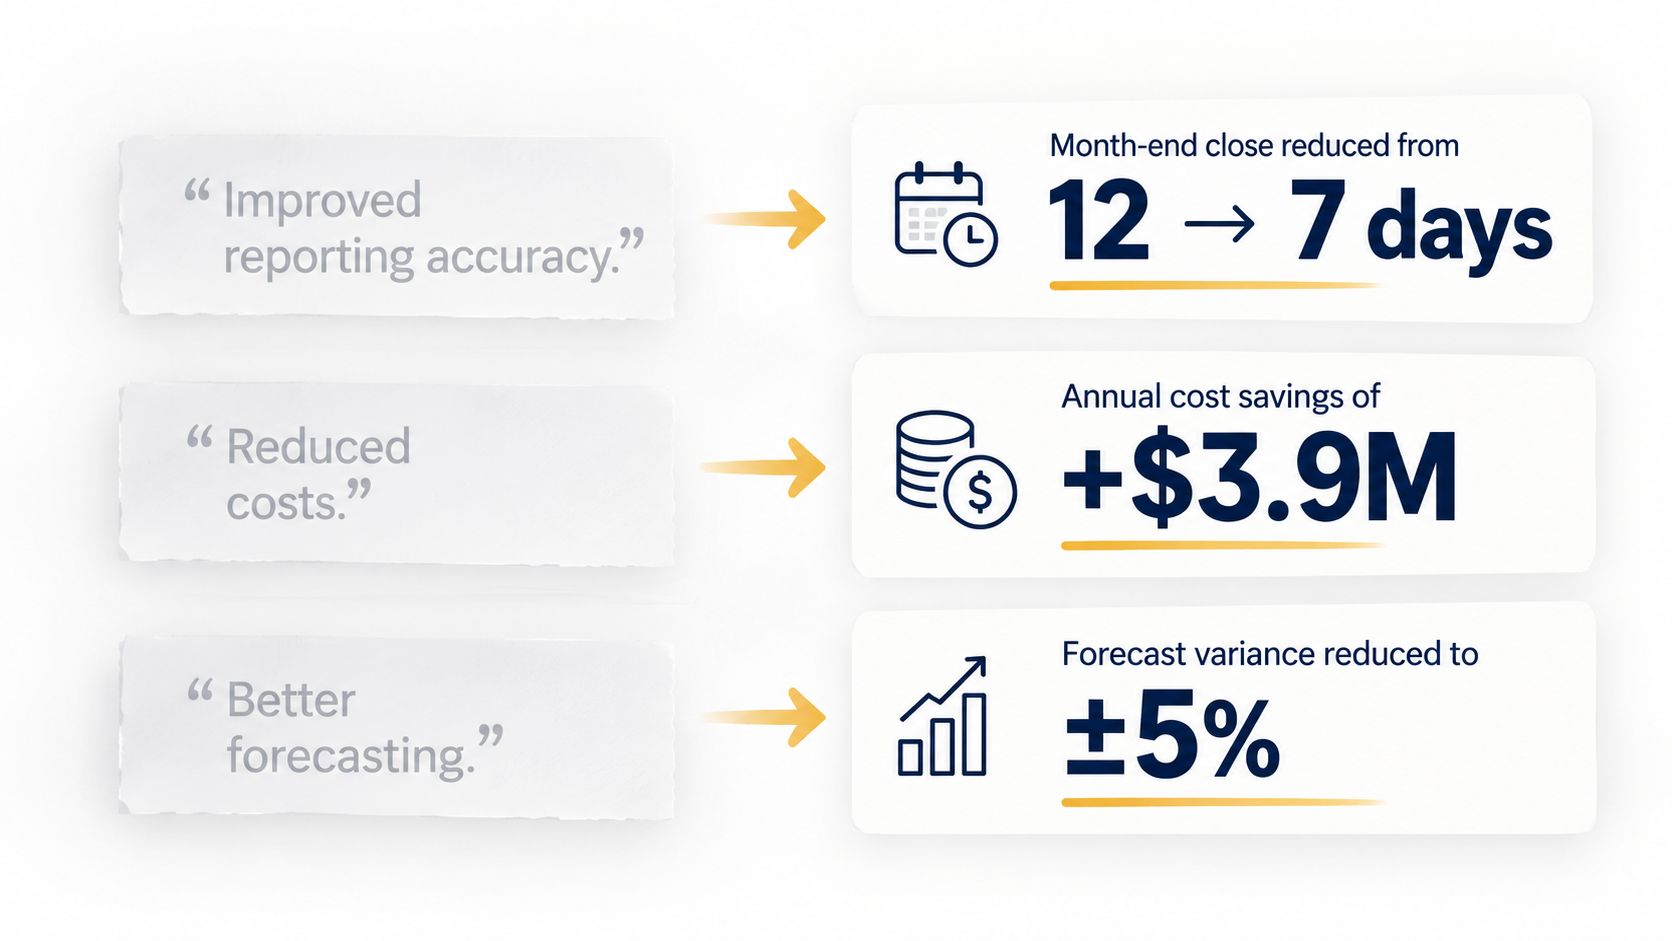
Finance is the function that measures everything, yet most finance resumes contain surprisingly few numbers. "Improved reporting accuracy." "Streamlined the close process." "Reduced costs." These claims are vague, unprovable and easy to ignore. For a profession built on numbers, an unquantified resume quietly undermines your credibility.
Quantifying impact is the fastest way to make a finance resume stand out. It shows you understand the business consequences of your work, gives reviewers something concrete to remember, and gives you proof points to defend in an interview. This guide shows you how to find your numbers, build them when they aren't obvious, and present them honestly.
1. Why Numbers Matter More in Finance Than Anywhere Else
Recruiters and hiring managers in finance read resumes with a particular bias: they expect fluency with metrics. A bullet without a number raises an unspoken question: if this person can't measure their own impact, how will they measure ours?
Quantified bullets do three things:
- Prove scale: they show the size of what you managed (budget, volume, headcount).
- Prove results: they show what changed because of you.
- Prove business sense: they show you know which numbers matter.
2. The Six Types of Metrics Every Finance Professional Can Use
If you're stuck, scan this list. Almost every finance role touches at least four of these.
| Metric type | Examples |
| Money saved or protected | Cost reduction, cost avoidance, fees eliminated, leakage recovered |
| Money made or enabled | Revenue influenced, margin improvement, capital raised, working capital released |
| Time and speed | Days cut from close, hours saved per cycle, faster reporting turnaround |
| Accuracy and quality | Forecast variance, error rate, audit findings, restatements avoided |
| Scale and scope | Budget size, revenue managed, number of entities, transaction volume, team size |
| Risk and compliance | Control gaps closed, SOX deficiencies remediated, penalties avoided |
3. Start With Scale to Anchor Every Bullet
Even when you can't prove a result, you can almost always prove scale. Scale tells the reader how large the stage was.
Without scale: "Managed the budget for the marketing department."
With scale: "Managed a $28M annual marketing budget across 6 channels and 4 regions, partnering with the CMO on quarterly reallocation decisions."
Scale numbers (dollars, headcount, entities, volume, geographies) should appear in your summary and in the first bullet of each role, so the reader knows the size of your world immediately.
4. Use the Quantification Formula: Metric + Method + Meaning
A strong quantified bullet has three parts:
- Metric: the number or percentage that changed.
- Method: what you did to cause it.
- Meaning: why it mattered to the business.
Example: "Cut month-end close from 12 to 7 days (metric) by standardizing reconciliations across 6 business units (method), giving leadership a full extra week to respond to market shifts (meaning)."
If a bullet has only the metric, it reads as a statistic. If it has the metric and meaning but no method, it reads as luck. All three together read as impact you can repeat.
5. How to Calculate Numbers You Don't Have
Many professionals say "I don't have the data." Usually, you can build it. Here are practical methods:
Time saved
Hours saved per cycle × number of cycles per year Example: Automated a 6-hour weekly report → about 300 hours saved annually.
Cost savings
Old cost − new cost, annualized Example: Renegotiated a vendor contract from $480K to $420K → $60K annual savings.
Percentage improvement
(Old value − new value) ÷ old value Example: Close time from 12 to 7 days → about 42% faster.
Working capital impact
Days improved × average daily revenue (for DSO) or daily COGS (for DPO) Example: DSO down 9 days on $160M revenue → roughly $3.9M of cash released.
Error or accuracy improvements
Compare error counts, adjustments, or forecast variance before and after, and name the period.
Team impact
Attrition rate before vs. after, internal promotions, time to hire, time to productivity.
Always keep a short note of how you calculated each figure. You will be asked in interviews.
6. Where to Find Your Data
If you don't have the numbers on hand, look in these places:
- Old reports, dashboards and board decks you produced or contributed to
- Performance reviews and self-assessments, which often contain metrics you've forgotten
- Project documentation, status updates and post-mortems
- Audit reports and management letters (findings before and after)
- Budget-vs-actual files and forecast history
- Emails and thank-you notes that mention results
- Former colleagues or your manager, who may recall figures you've lost
If you're still employed, start collecting this data now. It's much harder to reconstruct after you've left.
7. When You Truly Can't Quantify: Alternatives That Still Work
Some work is hard to put a number on. In those cases, use one of these approaches rather than leaving the bullet vague:
- Use scope or frequency: "Delivered weekly cash forecasts to the CFO and treasury committee across 9 entities."
- Use a range or estimate, labeled honestly: "Reduced manual reporting by an estimated 15-20 hours per month."
- Use a before/after description without a number: "Replaced a manual, error-prone consolidation with an automated process that eliminated recurring audit adjustments."
- Use outcomes others noticed: "Selected by the CFO to lead the finance workstream for the ERP migration after improving forecast reliability."
- Use recognition: promotions, awards, expanded scope, being asked to lead a project.
8. Choose the Right Format for the Number
How you present a number changes how it lands.
- Percentages show improvement ("cut costs by 18%") but can feel small or abstract without a base.
- Absolute dollars show scale ("saved $1.2M annually") and often hit harder.
- Both together is the strongest: "Reduced vendor spend by 14% ($1.2M annually)."
- Time is more vivid in days or hours than in percentages: "from 12 days to 7."
- Ratios and comparisons help with context: "managing 3x the transaction volume with the same headcount."
When in doubt, pair a percentage with the dollar or time figure behind it.
9. Common Mistakes When Quantifying
Mistake 1: Inflating or inventing numbers. Every figure should be defensible in an interview. If you can't explain how you calculated it, don't use it.
Mistake 2: Claiming team results as personal results. Be clear about your role: led, co-led or contributed. Credibility matters more than a bigger number.
Mistake 3: Leaving out the baseline. "Improved forecast accuracy to 94%" means little without the "before." Always show the starting point when you can.
Mistake 4: Using vanity metrics. "Processed 5,000 invoices" describes volume, not impact. Pair it with a result: "Processed 5,000 invoices monthly with a 99.6% first-pass accuracy rate, reducing rework by 30%."
Mistake 5: Burying the number. Put the metric early in the bullet, where the eye lands first.
Mistake 6: Over-quantifying. A resume where every line is a number reads as noise. Reserve quantification for your strongest achievements and use clear scope statements elsewhere.
Mistake 7: Ignoring confidentiality. If exact figures are confidential, use percentages, ranges or generalized descriptions ("a $500M+ revenue division") rather than disclosing sensitive details.
10. Before-and-After Examples by Finance Function
FP&A
- Before: "Prepared monthly forecasts and variance analysis."
- After: "Rebuilt the rolling forecast around 12 key business drivers, improving accuracy from ±18% to ±5% within two quarters and informing $9M in hiring and inventory decisions."
Accounting / Controllership
- Before: "Responsible for month-end close."
- After: "Cut month-end close from 11 to 6 working days across 5 entities by standardizing reconciliations, enabling earlier management reporting and reducing overtime by about 25%."
Accounts Payable / Receivable
- Before: "Managed collections."
- After: "Reduced DSO from 58 to 47 days through tiered collections and customer-level escalation, releasing roughly $3.5M in working capital."
Treasury
- Before: "Handled daily cash management."
- After: "Centralized cash visibility across 12 bank accounts in 4 countries, redeploying $8M of idle cash and lowering annual short-term borrowing costs by $110K."
Audit / Compliance
- Before: "Supported SOX compliance."
- After: "Remediated 14 control deficiencies ahead of the audit, delivering a clean SOX opinion with zero material weaknesses and cutting external audit fees by about 8%."
Finance Leadership
- Before: "Managed a team of 10."
- After: "Led a 10-person finance team through a post-acquisition integration, reducing attrition from 28% to 9% and promoting 3 team members into senior roles within 18 months."
11. A Simple Worksheet to Quantify Any Bullet
For each role, answer these questions:
- What was the scale (budget, revenue, volume, team size, number of entities)?
- What was the problem or baseline when I started?
- What did I specifically do?
- What number changed (time, money, accuracy, risk, headcount)?
- How do I calculate or verify that number?
- Why did it matter to the business?
Then combine the answers into a single bullet using Metric + Method + Meaning.
Quick Self-Audit
- [ ] Does your summary and the first bullet of each role state your scale?
- [ ] Does at least 70-80% of your bullets contain a number, percentage or time frame?
- [ ] Does each key number show a baseline (before) where possible?
- [ ] Can you explain how you calculated every figure?
- [ ] Is your personal role clear (led, co-led, contributed)?
- [ ] Have you paired percentages with dollar or time figures for your biggest wins?
- [ ] Have you avoided inflated, invented or confidential figures?